
Documents
The Relationship of Voltage and SOC of LiFePO4 batteries in different temperatures
Background
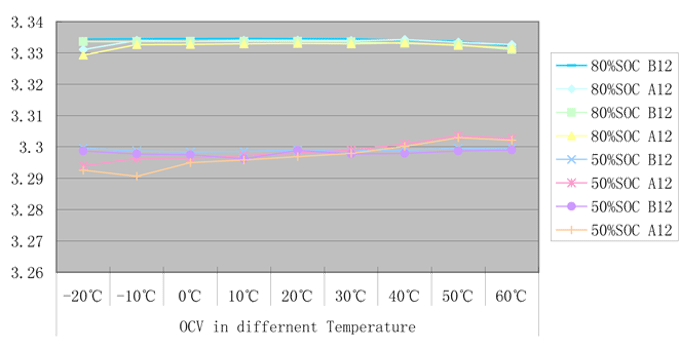
In order to help customers discover the slight differences in the OCV (Open Circuit Voltage) that LiFePO4 batteries exhibit in different temperatures and SOC, (State of Charge) we have made a simulated test to show the relationship of those parameters under different conditions. With this information the customer can make the necessary modifications in charging methods and charging voltage to best maintain the battery pack in a long term float charge condition.
Procedures and Steps
1. Prepare 8 pcs of 10Ah LiFePO4 Pouch cells for the test.
2. Charge and discharge cells for 2 cycles with C/2 current, log the capacity of cells.
3. According to the capacity, charge all cells to the pre-seted SOC.
(100%SOC, 90%SOC, 80%SOC, 50%SOC)
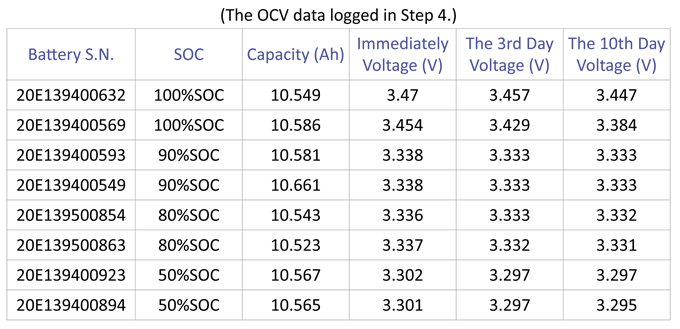
4. After all the cells are charged, tests are made to establish the voltage immediately, log the volume (Marked as the Immediate Voltage). Put them on a shelf for 3 days, then log the voltage (Marked as the 3rd day voltage). Then put all cells on a shelf for 7 days, log the voltage (Marked as the 3rd day voltage).
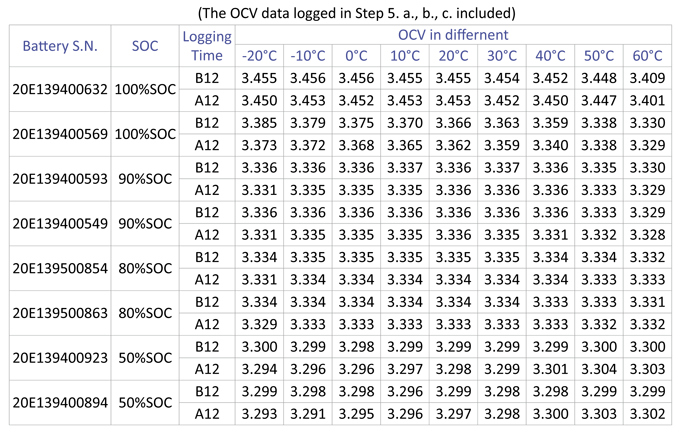
5. Put all cells in the "temperature-controlled cabinet" and log the voltage's at different temperatures (-20°C, -10°C, 0°C, 10°C, 20°C, 30°C, 40°C, 50°C, 60°C), see following:
a. In 4 hours the temperature is gradually changed to -20°C ,we then log the OCV of all the cells (Marked as B12, means before 12 hours), then keep 12 hours in this temperature, after that we log the OCV of all cells again (Marked as A12, which means after 12 hours), then the temperature is gradually changed to the next temperature in next 4 hours.
b. After 4 hours when temperature is changed to -10°C., log the OCV of all the cells (Marked as B12), then keep for another 12 hours in this emperature, after that we log the OCV of all cells again (Marked as A12), then gradually change the temperature to in next 4 hours.
c. Repeat a. and b. but set temperature to 0°C, 10°C, 20°C, 30°C, 40°C, 50°C, 60°C, got the OCV readings.
Data Record 1
Data Record 2
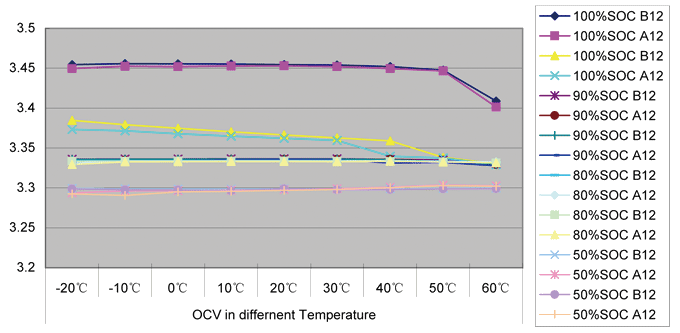
Curves Generated:
90% and 80% SOC state, cell's volt,
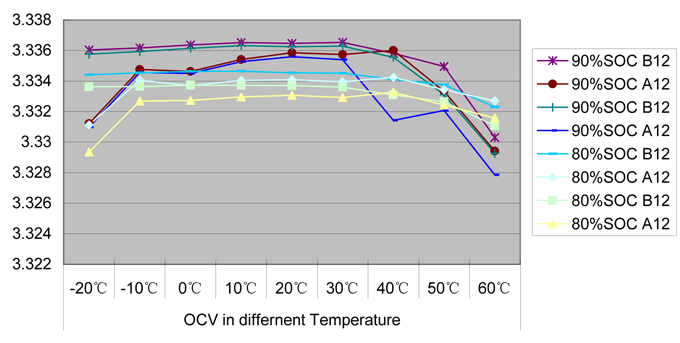
80% and 50% SOC state, cell's volt,
For a detail report including analysis and conclusion, please contact us via This email address is being protected from spambots. You need JavaScript enabled to view it.